Today, I’d like to share with you that the formula that I introduced in my blogs of September 3, 2021, “A Super Simple Formula to Dispel Fears of Plummeting Sales under COVID-19” and September 11, 2021, “Understanding Continuity is Power with a Formula” actually hides another essential secret.
Let’s start with the formula.
$$x_{t}=αx_{t-1}+µ+ε_{t}\tag{1}$$
xt is the sales at time t, xt-1 is the previous sales, α is the sales coefficient, µ is a constant, and εt is the error term. This simple equation taught us that sales that dropped due to COVID-19 will always return to normal, and conversely, sales that temporarily increased rapidly will return to normal if no action is taken afterwards. In each of these cases, we have looked at the time series change in sales xt by stimulating the error εt in equation (1) to negative or positive values.
Equation (1), when expanded based on the rule, leads to equation (2), which is
$$x_{t}=αx_{t-1}+µ+ε_{t}=α^tx_{0}+µ(1+α+α^2+α^3+ ・・・+α^t)+(α^{t-1}ε_{1}+α^{t-2}ε_{2}+α^{t-3}ε_{3}+・・・+ε_{t})\tag{2}$$
First term: $α^tx_{0}$ approaches zero when $α<1$.
Second term: $µ(1+α+α^2+α^3+ … +α^t)$ converges to a certain value when $α<1$.
The third term: $α^{t-1}ε_{1}+α^{t-2}ε_{2}+α^{t-3}ε_{3}+…+ε_{t}$ is a collection of errors with coefficients and is normally distributed
For example, a COVID-19 is a large negative stimulus to part of the third term, while a temporary surge in sales is a large positive stimulus. In both cases, when the stimulus passes, the situation returns to its normal steady state. Now, if we look closely at equation (2), we can see that it is not only the third term (error term) that raises the level of sales xt. Pay attention to the second term, µ. Depending on whether this µ is large or small, the value of convergence will vary greatly. In fact, it can be said that this term has a more essential impact on sales. In other words, this µ is the manager’s perspective.
Now, let’s start the calculation. Fig. 1 shows the time series change in xt when µ is doubled to 20 after t=10.
Fig. 1
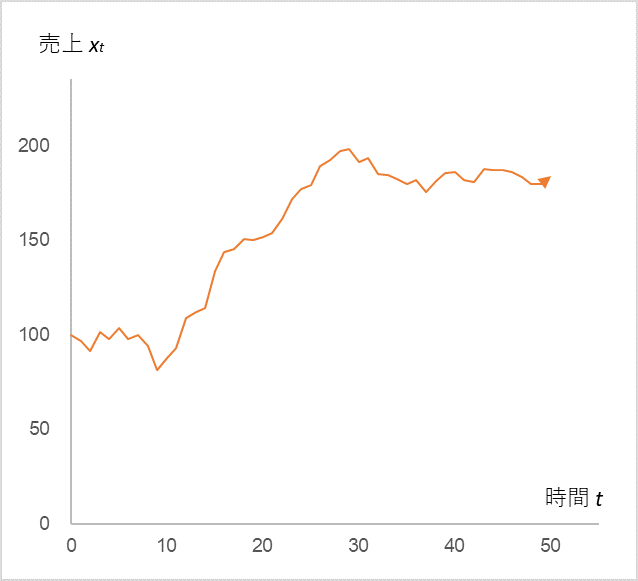
Let x0=100, α=0.9, and εt=N(0,5) be a normal distribution.
The time series change in sales xt when the value of µ is increased from 10 to 20 after t=10
Indeed, when the manager doubles the value of µ, the sales xt also doubles. Now, suppose further that aggressive advertising activities were carried out from t=10 to 13 and continued thereafter (Fig. 2).
Fig. 2
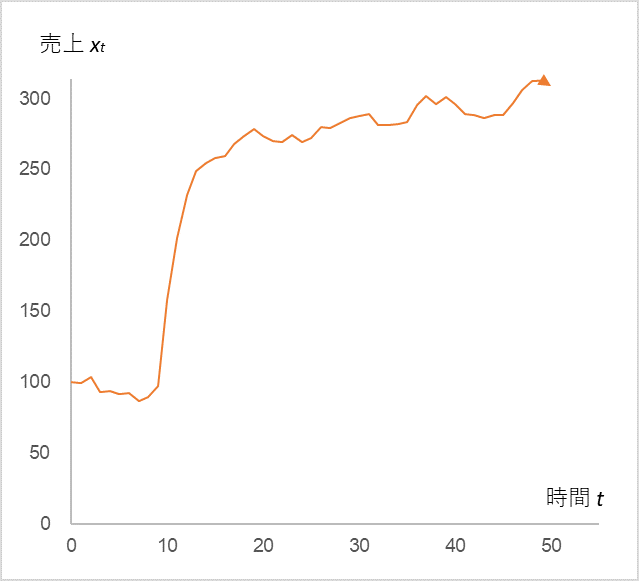
x0=100、α=0.9、ε0~10=N(0,5) , ε11~=N(10,5)
ε10=50, ε11=40, ε12=30, ε13=20
µ is 10 until t=9, and 20 after t=14
The sales tripled due to the “combined effect” of the continuous advertising activities!
This concludes our three-part series on time series analysis. Even though equation (1) is very simple in form, it has taught us many things such as:
- Sales will return to normal even if they are depressed by a temporary negative stimulus.
- Continuous stimulation (advertising etc.) is necessary to maintain a temporary increase in sales.
- In order to raise the level of sales, the manager must not be satisfied with the current business, but must raise his or her perspective.
These things seem to be affirmable through experience, but if we are asked if this is absolutely true, we would say that there are exceptions. However, we can be confident now that our rules of thumb are backed up by mathematics. Am I the only one who feels an indescribable sense of reassurance?
<Reference>
Tatsuyoshi Okimoto, AR Process, Econometric Time Series Analysis of Economic and Financial Data, Asakura Shoten, 2021
Back to archive