Is management “experience and intuition?” or “Vision and strategy?” Neither of these can be denied, but they have in common the fact that they are not “quantified”. The motion of an object can be expressed in mathematical equations using Newton’s equations of motion, and the number of people infected with coronaviruses can be predicted and calculated using mathematical models. We are now living in an age where we can quantify all kinds of indicators of our own health, and by tracing the changes in these indicators, we can predict our future health status and prevent diseases.
Theories in natural science are always proven correct by experiments and observations. On the contrary, we can say that theories are constructed in order to explain natural phenomena well. If this is the case, then I believe that we can also develop theories to explain social phenomena mathematically. Today’s theme is “growth”.
Growth
Suppose that manager A decides to increase the current sales $x_{0}$ by the same amount $a$ every year, and achieves it. If the initial sales $x$ is zero and the subsequent increase $a$ is $1$, the sales after an arbitrary time $t$ will be a straight line as shown in Fig. 1.
Fig. 1
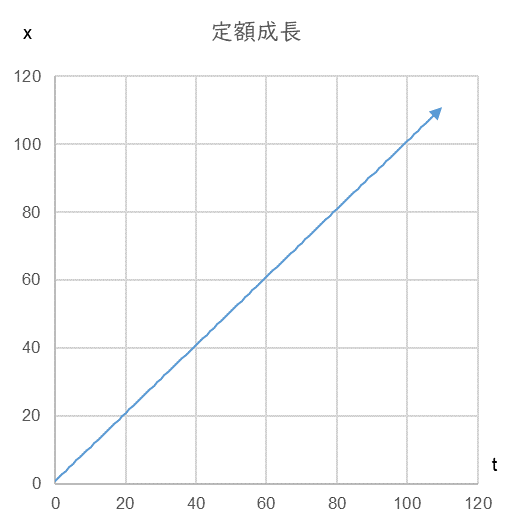
Time series change in sales when sales x increases by a constant amount a=20 with arbitrary time t.
Future sales are on this straight line.
Since sales continue to increase in a straight line, it looks like a smooth business. But look at Figure 2. This is a graph of the percentage increase in sales over the previous year. It is declining as time passes. The rate of change in “fixed amount” growth sales is a “downward convex curve”.
Fig. 2
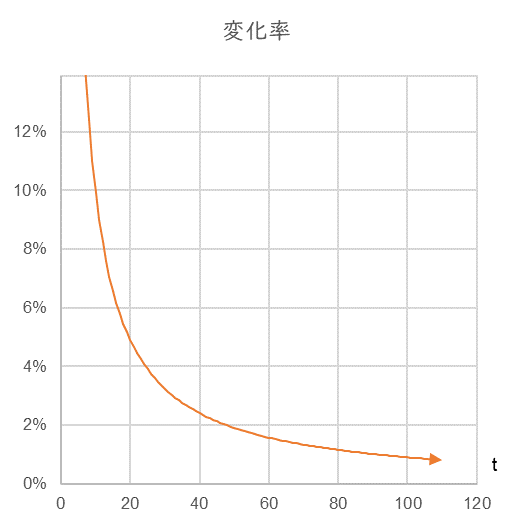
Time series of the rate of change of a fixed-growth sales x with arbitrary time t.
The rate of change of sales is a downward convex curve and will continue to decline indefinitely.
So, with an initial value of $x_{0}=1.0$, what would be the sales of a business that grows at a rate of 5% change per unit time? See Fig. 3. The curve is right ascendant and convex below.
Fig. 3
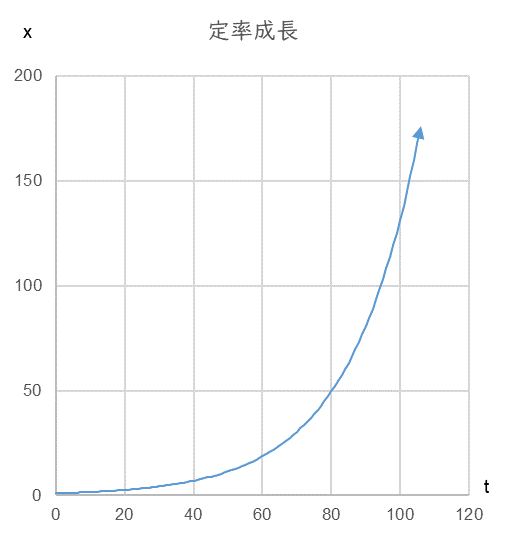
This is the time series change in sales x for a 5% rate of change per unit time. Future sales will be on this upward convex curve.
On the other hand, since the rate of change is constant at 5%, the curve is a horizontal straight line (Fig. 4).
Fig. 4
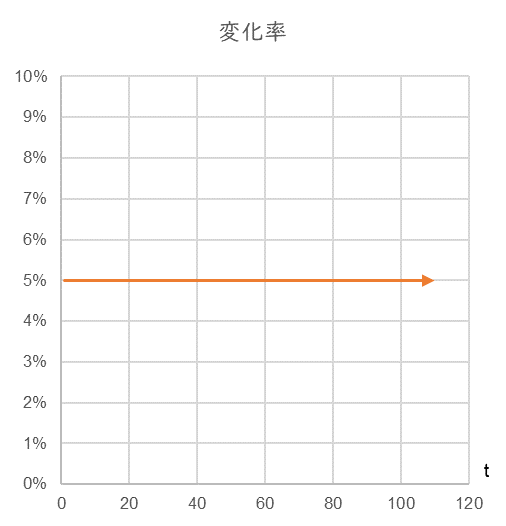
Time series of the rate of change of a fixed rate of change 5% with arbitrary time t.
Now, in order to maintain a constant growth, whether it is a fixed rate or a constant rate, it is necessary for the manager to keep thinking so. This belief must be unshakeable at any “moment”. This will form the “basic behavioral pattern” of the manager. The basic pattern of behavior at any given moment is denoted as $frac{dx}{dt}$.
In the case of constant growth, the basic behavioral pattern is to increase by the same amount of $α$ (units are arbitrary) each time, regardless of the previous sales (previous month, previous year, whatever units are used), so
$$frac{dx}{dt}=αtag{1}$$
This is a basic behavior pattern. If we assume that the sales $x_{0}$ in the first year is zero and the fixed amount increment $α$ we aim for is 1, the relationship between time $t$ and sales $x$ is as shown in Table 1.
表1
| Time $t$ | Sales $x$ (Fig. 1) | Change rate of Sales $x$(Fig. 2) | $$frac{dx}{dt}=α$$ |
| 0 | 0 | ||
| 1 | 1 | 100.0% | 1 |
| 2 | 2 | 50.0% | 1 |
| 3 | 3 | 33.3% | 1 |
| 4 | 4 | 25.0% | 1 |
| 5 | 5 | 20.0% | 1 |
| 6 | 6 | 16.7% | 1 |
| 7 | 7 | 14.3% | 1 |
| 8 | 8 | 12.5% | 1 |
On the other hand, in the case of constant growth, the manager needs to be constantly aware of the latest sales $x$. This is because it is necessary to increase sales by the amount obtained by multiplying the previous year’s sales by the desired growth rate (let’s say $r$). Therefore, the basic pattern of behavior in this case is to multiply the latest sales $x$ by $r$, so
$$frac{dx}{dt}=rxtag{2}$$
If the first year’s sales $x_{0}$ is $1$ and $r$ is $0.05$, the relationship between time $t$ and sales $x$ is as shown in Table 2. The first year’s sales $1.0$ multiplied by $0.05$ is the increment to be achieved in the next year. Therefore, the sales to be achieved in the next year is $1.0+0.05=1.05$. Similarly, in the third year, we need to increase our sales by $1.05$ multiplied by $0.05$, or $0.053$, so the sales we should aim for is $1.05+0.053=1.103$.
Table 2
| Time $t$ | Sales $x$ (図3) | Change rate of sales $x$ (Fig.4) | $$frac{dx}{dt}=rx$$ |
| 0 | 1.000 | ||
| 1 | 1.050 | 5.0% | 0.050 |
| 2 | 1.103 | 5.0% | 0.053 |
| 3 | 1.158 | 5.0% | 0.055 |
| 4 | 1.216 | 5.0% | 0.058 |
| 5 | 1,276 | 5.0% | 0.061 |
| 6 | 1.340 | 5.0% | 0.064 |
| 7 | 1.407 | 5.0% | 0.067 |
| 8 | 1.477 | 5.0% | 0.070 |
Now, look again at the graph of constant rate growth (Fig. 3). As it is, it diverges to infinity. Since sales cannot be larger than the market size itself, and there is a limit to the market share, I believe that every manager has an “upper limit” more or less in his subconscious. Therefore, let’s incorporate this unconscious “upper limit” into the basic behavior pattern $frac{dx}{dt}$.
Let’s consider $1-frac{x}{K}$, where $x$ is sales and $K$ is the upper limit. The closer $x$ is to $K$, the closer $1-frac{x}{K}$ is to zero, so the growth should gradually slow down. Therefore, let’s multiply equation (2) by this $1-frac{x}{K}$.
$$frac{dx}{dt}=rx(1-frac{x}{K})tag{3}$$
In this case, the relationship between time $t$ and sales $x$ is as follows, since we can replace $frac{dx}{dt}=rx$ in Table 2 with equation $(3)$ (i.e., the basic behavior pattern changes).
Table 3
| $t$ | $x$ | Change rate of $x$ | $$frac{dx}{dt}=rx(1-frac{x}{K})$$ |
| 0 | 1.000 | ||
| 1 | 1.050 | 4.950% | 0.050 |
| 2 | 1.103 | 4.948% | 0.052 |
| 3 | 1.158 | 4.945% | 0.054 |
| ・ | ・ | ・ | ・ |
| ・ | ・ | ・ | ・ |
| 198 | 99.515 | 0.026% | 0.025 |
| 199 | 99.539 | 0.024% | 0.024 |
| 200 | 99.562 | 0.023% | 0.023 |
Time series of x and its rate of change when r=0.05, K=100
The graph looks like the solid line in Fig. 5. The curve has changed from a constant rate of growth that diverges to infinity (dashed line) to a curve with an upper limit (S-shaped curve).
図5
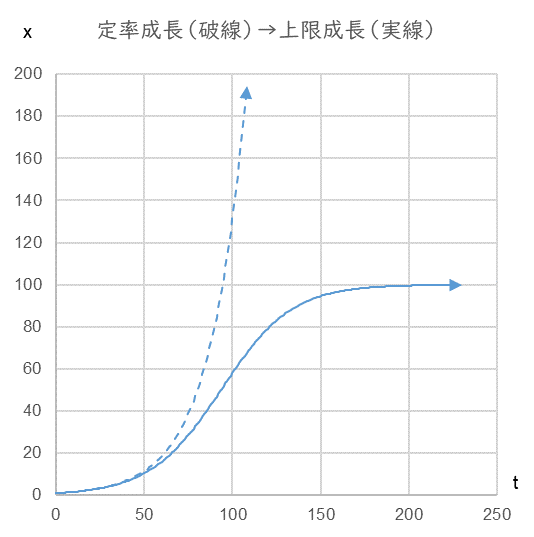
This “S-curve” is often seen in the diffusion rate of durable consumer goods.
Fig. 6
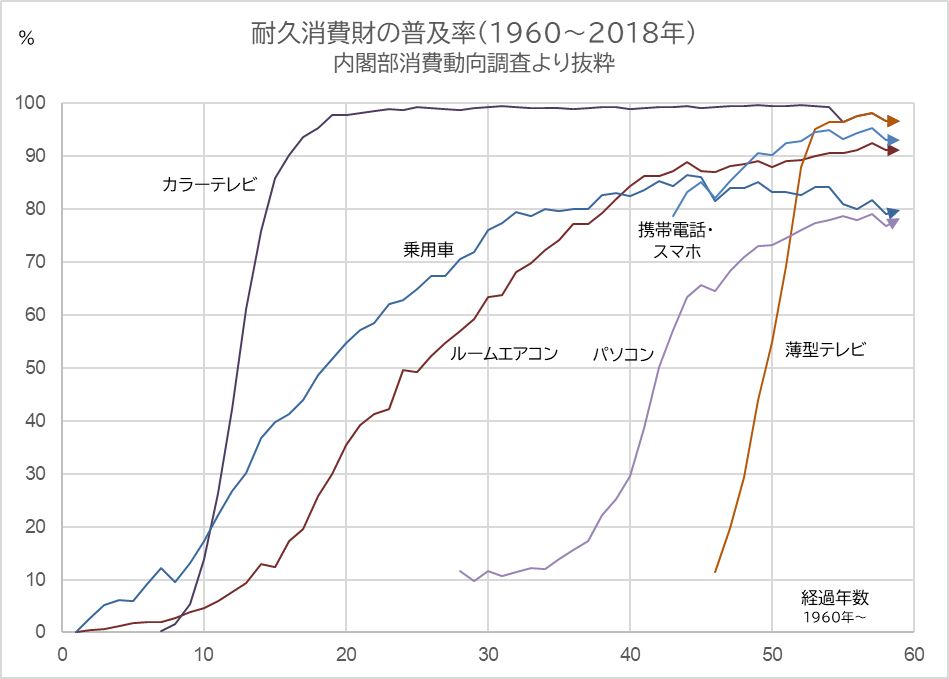
The higher the value of r in the growth coefficient, the steeper the slope of the growth curve
Purple: Color Tv sets, Blue: Passenger cars, Red: Air conditioners, Light purple: PC, Orange: Flat-screen TV sets
Now, if the manager considers it good that the business has reached the “upper limit”, the business will not grow any further. It is often said that a company cannot grow beyond the capacity of its manager. The “capacity of the manager” or the “height of the manager’s perspective” is $K$ in the equation $(3)$.
When sales growth slows down, whether or not the manager can raise his or her line of sight has a significant impact on the subsequent results. Look at Fig, 7. The dashed blue line is the growth curve when $K=100$, and the solid green line is the growth curve when $K$ is raised from $100$ to $200$ between $t=50 and $100$.
Fig. 7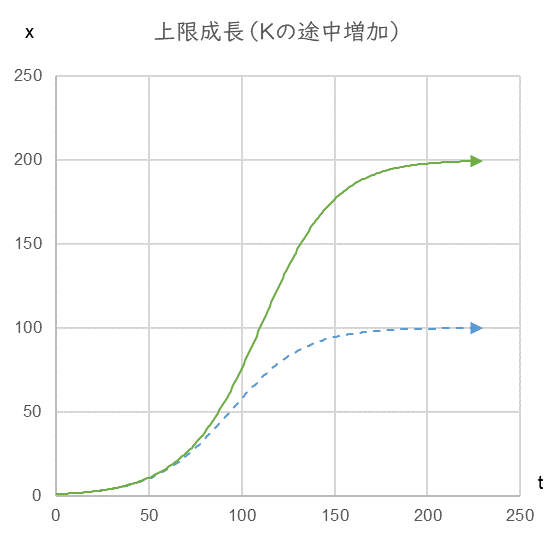
On the other hand, when one business reaches the upper limit, another one can be built up. Fig. 8 shows the growth curve when a business with $K=100$ (blue) reaches its upper limit, and another business with $K=100$ (green) is added.
Fig. 8

At this time, the rate of change is as shown in Fig. 9.
Fig. 9
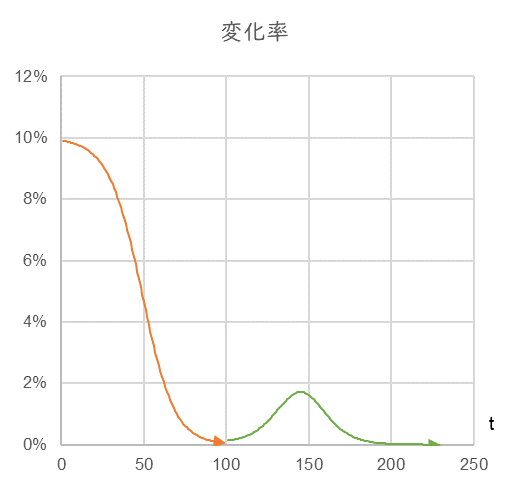
Fig. 9 shows that the rate of change, which has been declining over time, reverses to positive as new businesses are added. However, when the number of added businesses approaches its upper limit, the growth stops again. In other words, the rate of change approaches zero again, which means that we need to pay attention to the “change in the rate of change” and take action as soon as possible in order to achieve constant growth. In fact, in Fig. 8, how does the growth curve change when $K$ is increased in a staircase fashion?
Fig. 10
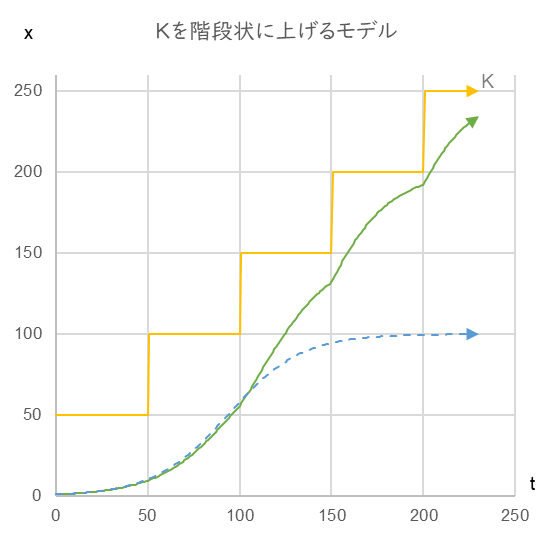
r=0.05, growth curve when K is increased in a stepwise manner from 50 to 100 to 150 to 200 to 250 (solid green line)
The solid green line in Fig. 10 is the growth curve achieved when we constantly raise our eyes without being satisfied with the upper limit. In this case, the rate of change is as follows.
Fig. 11

Rate of change of the growth curve in Fig. 10
Since running a business by constantly looking up is simply a pattern of behavior that attempts to increase sales over time, let’s change equation $(3)$ to the following
$$frac{dx}{dt}=at+btag{4}$$
The solid blue lines in Fig. 12 and Fig. 13 show the sales trends of 7-Eleven and Toyota Motor Corporation. The green curve is the curve drawn by equation (4), and you can see that it is a good approximation of the actual sales.
Fig. 12 Fig. 13

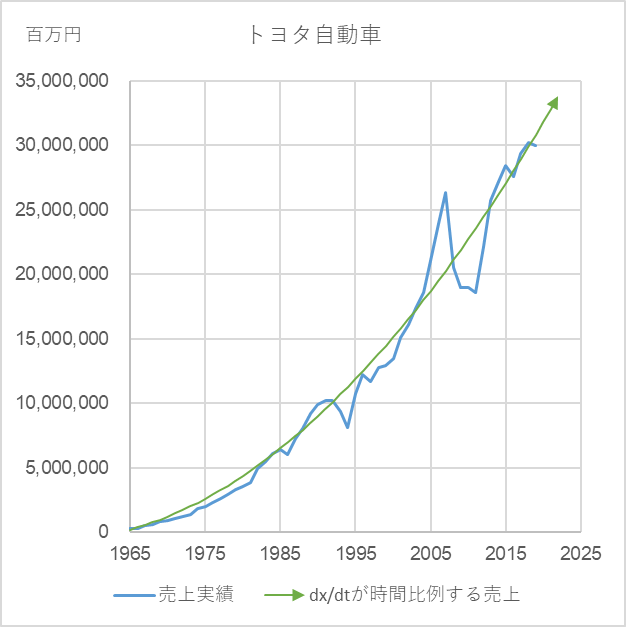
7-eleven: a=50, b=7 Toyota: a=14,800, b=160,000
7-Eleven: Original Data: Sales and Number of Stores | Seven-Eleven – Convenient and Close to Home (sei.co.jp)
Toyota Motor Corporation: Original data http://www.toyota.co.jp/jpn/company/history/75years/common/pdf/financialstatement_of_income.pdf
Now, we have emphasized that we should “raise our eyes”, but on the other hand, the market size itself may shrink. Let’s take $K$ as the decreasing market size, and change $K$ in equation $(3)$ to equation $(4)$.
$$frac{dK}{dt}=frac{a}{sqrt{t}}tag{4}$$
If we replace $K$ in equation $(3)$ with
$$frac{dx}{dt}=rx(1-frac{x}{frac{dK}{dt}})tag{5}$$
The result is the following. Look at the solid green line in Fig. 14. It has indeed reached its peak and then declined to the right.
Fig. 14

This is the growth curve for r=0.05, a=1.0, frac{dK}{dt}=frac{1}{sqrt{t}}
Solid green line and dashed blue line is the growth curve for K=100 (constant).
As a test, fitting equation (5) to the trend of average height and weight by age gives the following
Fig. 15 Fig. 16
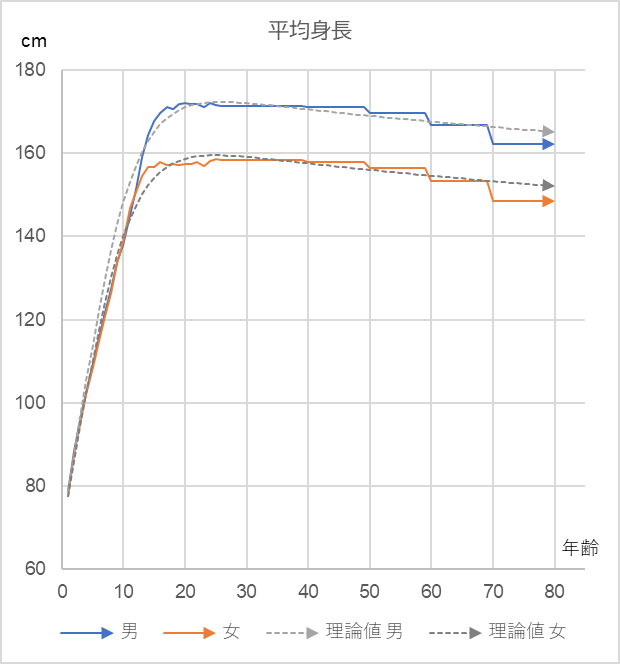

Original data: National Health and Nutrition Survey (Ministry of Health, Labor and Welfare, 2019)
Height (male): r=0.2, a=0.2, K_{0}=181
Weight (male): r=0.2, a=1.0, K_{0}=80
Height (female): r=0.2, a=0.2, K_{0}=172
These models have a wide range of applications because they grasp the essential features of growth. Please try to graph the data you have using the equations $(1)$ to $(5)$. It is easy to draw a graph by expanding the data into Excel as shown in Table 2 and Table 3. You are sure to make some interesting discoveries!
To be continued
Back to archive