In Part I, I applied the Dragon King Theory to the past data to predict the COVID19 shock. However, it is the fact that COVID19 shock occurred, so even if you claim that this is a theoretical consequence, you will probably be told that it can be manipulated.
Therefore, instead of using the historical data, we will use the ongoing stock price (“Bridgestone” in Tokyo Stock Exchange 5108). First, let’s look at the historical chart from 2019 to today (Figure 1).
Figure 1
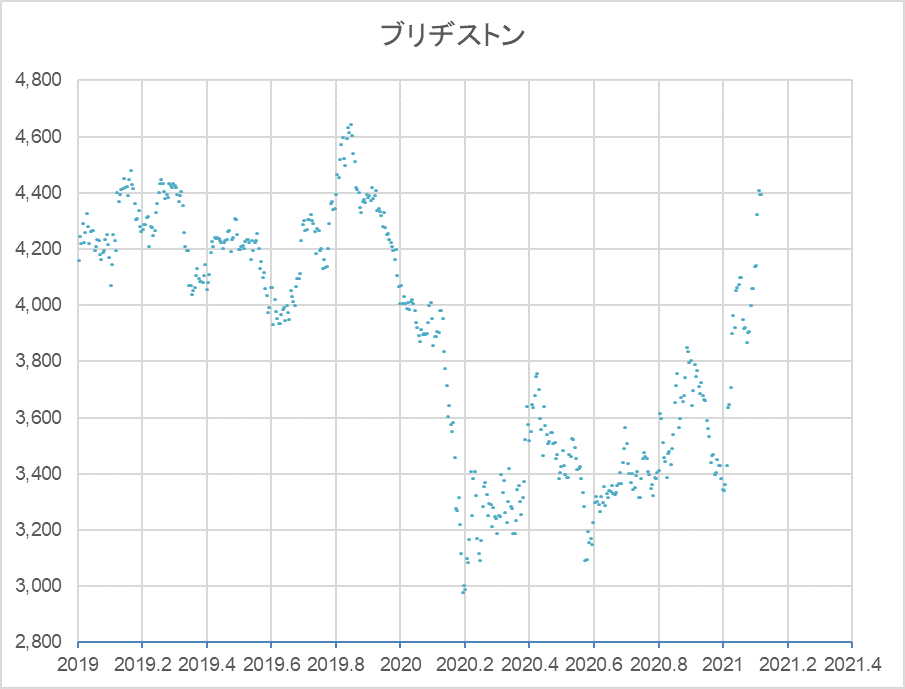
After hitting a high of 4,644 JPY on November 8, 2019, and then crashing in the so-called COVID19 Shock, the stock bottomed out at 2,981 JPY on March 16, 2020, and has been going up and down repeatedly since the beginning of this year.
Now, let’s do some fitting work using the formula $(3)$ to find the Dragon King. Please refer to Part 1 for the derivation of the formula and how to use it.
$$F_{lp}(t)=A+B(t_{c}-t)^m[1+Ccos(ωlog((t_{c}-t)/T))] tag{3}$$.
The result is shown in Figure 2.
Figure 2
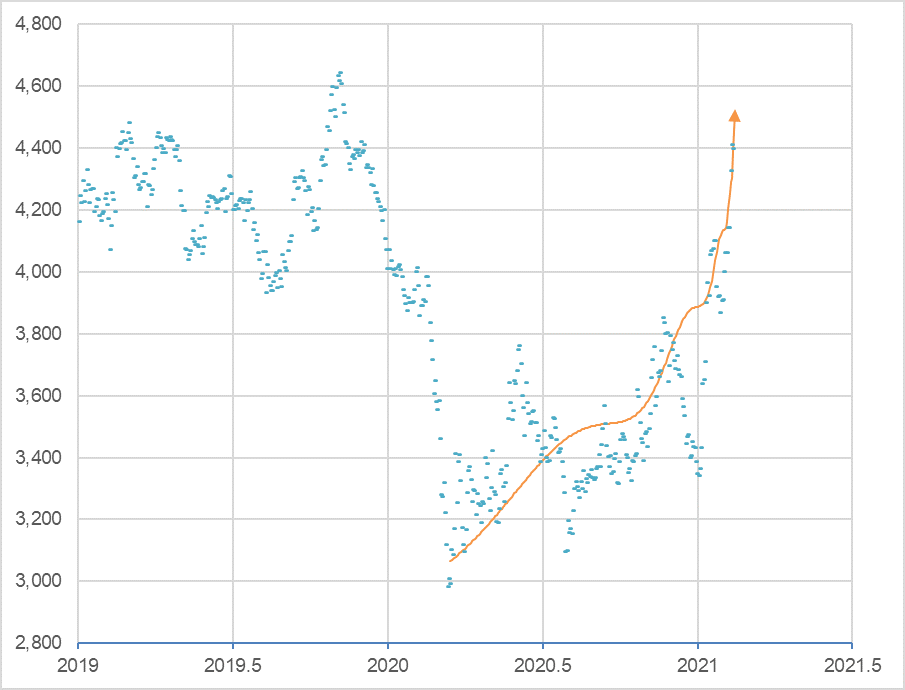
The log-periodic curve of Bridgestone’s closing price on February 15, 2021, indicates that the critical point (tc) is imminent.
Log-periodic curve: A+B(tc-t)m[1+Ccos(ωlog(tc-t)/T)]
A= 5,000, B = -1,900, m=0.28, C = 0.06, ω = 7.7, T = 1.2, tc = 2021.12 (2021/2/17)
$t_{c}$ is 2021.12 , February 16, 2021. Today is February 15, 2021. This means that the bubble is ready to burst at any time. It is possible that the Dragon King will appear tomorrow.
Verification on March 24 2021
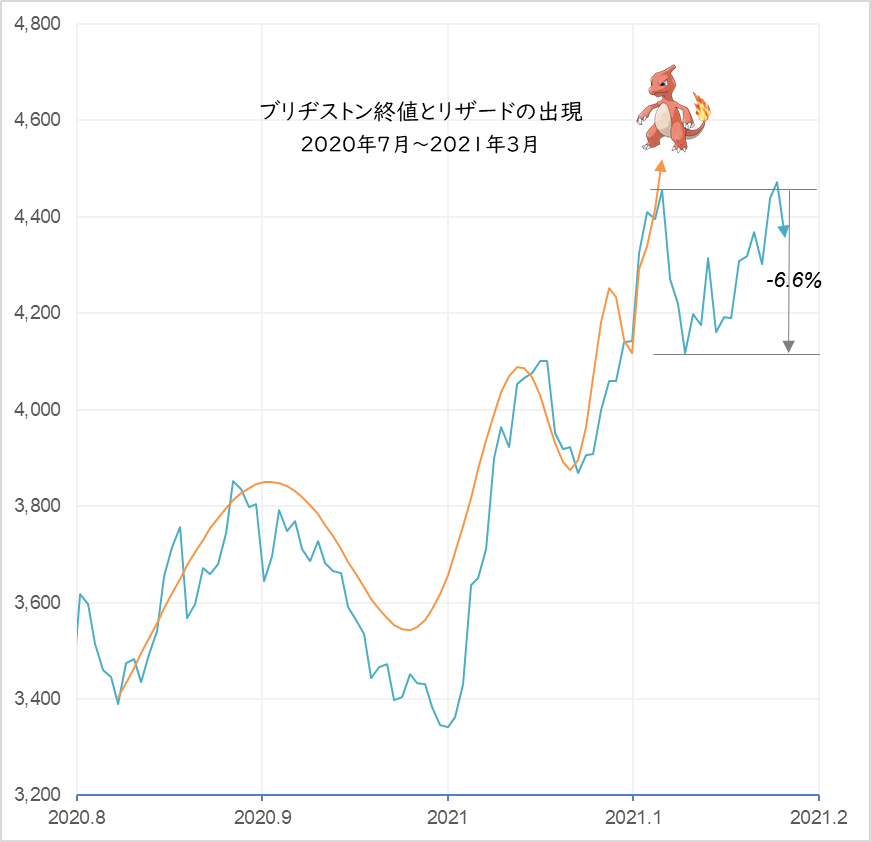
After reaching its peak at 4,455 JPY on February 16, 2021, the next day, it began to plummet on February 17, the day after that, dropping 6.6% all the way down to 4,161 JPY on February 26.
When the “Dragon King,” as Professor Sornette named it, appears, the market plunges 12-30% within 10 days (Why Stock Markets Crash, 2003, p. 63). On the other hand, even a drop of around 10% is too big a move for investors to ignore, so I would like to give it some kind of name. According to the Pokémon Illustrated Book, the one that looks exactly like the Dragon King is Lizardman. And since Lizard evolves into Lizardon, let’s say it’s Lizard’s (small dragon’s) work this time.
 Lizard (from Pokémon Picture Book)

Lizardon (from Pokémon Picture Book)
Figure 2
Bridgestone closing prices and the newly drawn log-periodic curve.
A= 4,650, B = -1,800, m = 0.35, C = 0.24, ω = 9.6, T = 1.55, tc = 2021.12 (2021/2/17)
The probability distribution curve derived from the stochastic differential equation is a bow-shaped line that expands upward during the upward phase, while the log-periodic curve is a bow-shaped line that expands downward. Note the movement from January 29 to February 16 in Figure 3. The movement during this period can be traced not by the upward swelling sigma line but by the downward swelling bow line. This downward curve is called “Power law curve” from now on. If we give a fluctuation to the power law curve, it becomes a log-periodic curve. The formula is as follows.
Power law curve:
$$F_{pow}(t)=A+B(t_{c}-t)^m tag{1}$$
Log period:
$$F_{lp}(t)=1+Ccos(ωlog((t_{c}-t)/T)) tag{2}$$
Log period curve:
$$F_{lp}(t)=A+B(t_{c}-t)^m[1+Ccos(ωlog((t_{c}-t)/T))] tag{3}$$
Figure 3
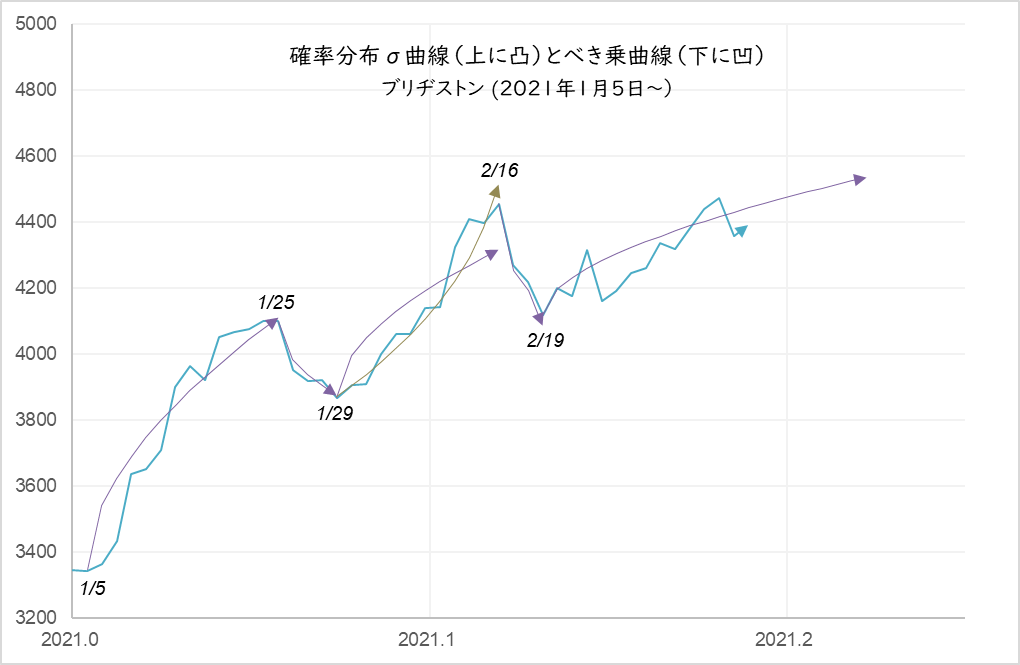
The period from Jan. 29 to Feb. 16 follows the power law curve, which can be viewed as a -6.6% adjustment.
Power curve: A+B(tc-t)m (A=4,950, B=-3,100, tc=2021.123, m=0.35)
In this way, by constantly checking stock price movements using both the probability distribution line and the power curve, we can not only predict future stock prices with considerable accuracy, but we may also be able to detect signs of a sharp decline to some extent in advance.
I will continue to verify this.
Back to archive