There is a lot of talk about whether or not the COVID-19 vaccine will work against mutants. Since some countries are recommending a third vaccination or using heterologous vaccines, it seems reasonable to assume that the same vaccine will gradually lose its effectiveness.
But why do viruses mutate in the first place? It seems that it is due to genetic copy errors that occur when viruses multiply. The probability of this happening is 10-4, or one in 10,000, according to the video “Systems Biology (4) (Kinetic Calibration)” by science YOUTUBER Yobinori. Even if a virus escapes once or twice, it will eventually be caught by the immune system, so it is destined to keep evolving. In other words, viruses are forced to continuously run faster than the immune system in a “race for life.
Today’s theme is to analyze this “race” mathematically. If we think that we have prepared a space for the virus to mutate (a track for the race) and let it move freely, we can use the differential equation including the “diffusion term” that we saw in geographical growth. Here, we use the “antigen escape model” (Sasaki, A. (1994). Evolution of antigen drift and switching – continuously evading pathogens. J. Theor. Biol.
Let’s take a look at the equation. N is the density of antigen (virus) and B is the density of antibody.
$$\frac{∂N}{∂t}=[r-µ(1-p)]N-βNB+pu\frac{∂^2N}{∂x^2}\tag{1}$$
$$\frac{∂B}{∂t}=αNB\tag{2}$$
where r is the growth rate of the virus, µ is the mutation rate, p is its effective rate, and α and β are coefficients for the strength of the immune response. Equation (1) shows how a virus tries to survive by changing its shape while being attacked by antibodies, while equation (2) shows how antibodies chase the virus.
Now, let’s do some actual calculations by adding specific coefficients to these formulas. The starting point is x12 for both antigen N (virus) and antibody B. The initial density is 0.01 for N and 0.001 for B. The time interval (⊿t) is 5.0.
The other coefficients are as follows.
| Antigen growth rate | r | 0.12 |
| Mutation rate | µ | 10-4 |
| Effective mutation rate | p | 0.5 |
| Immune response rate | α | 0.1 |
| Immune response rate | β | 0.1 |
The vertical axis is the density D of antigen N and antibody B, and the horizontal axis x is the space where the mutant appears. Figure 1 shows the movement of the data when time is advanced in steps of t=50.
Figure 1
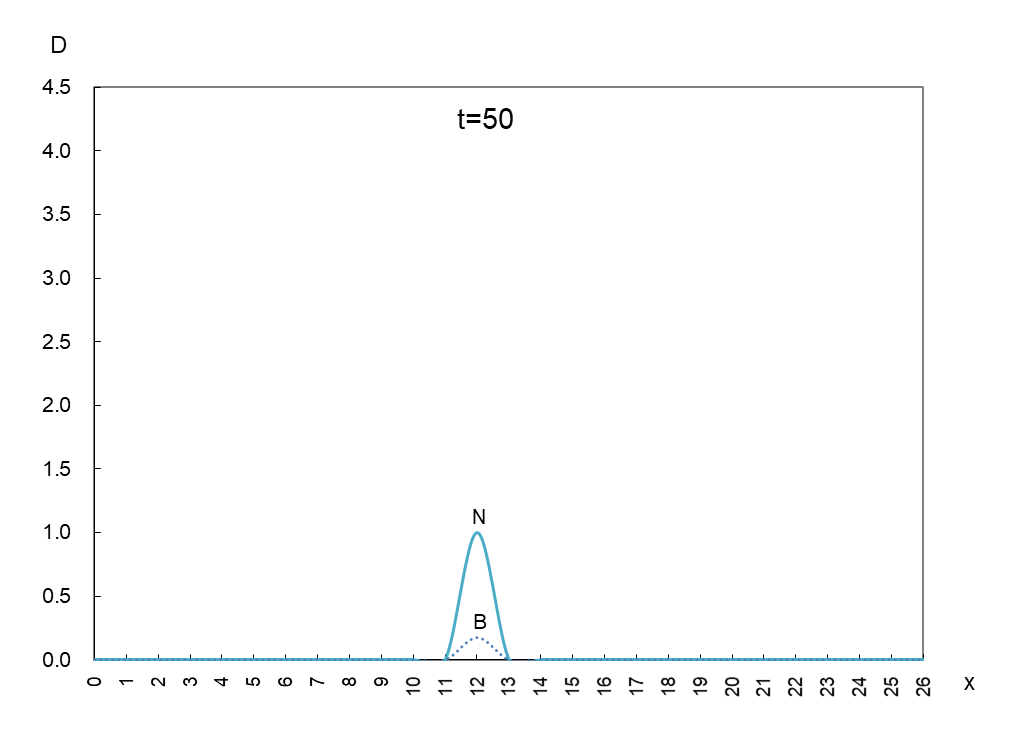
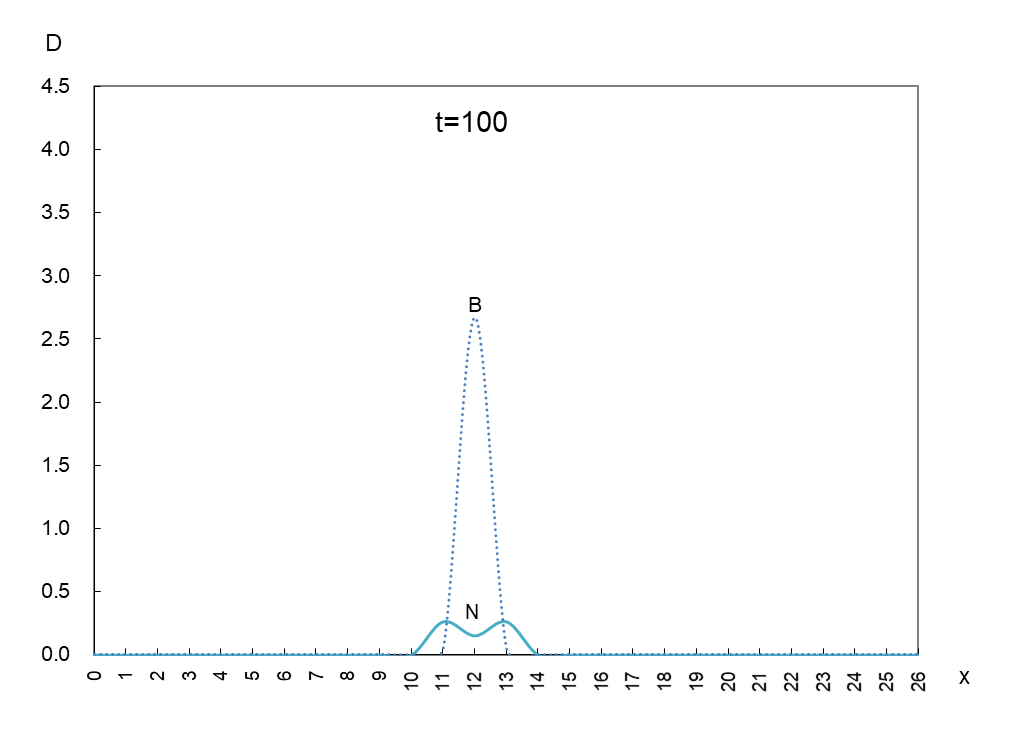
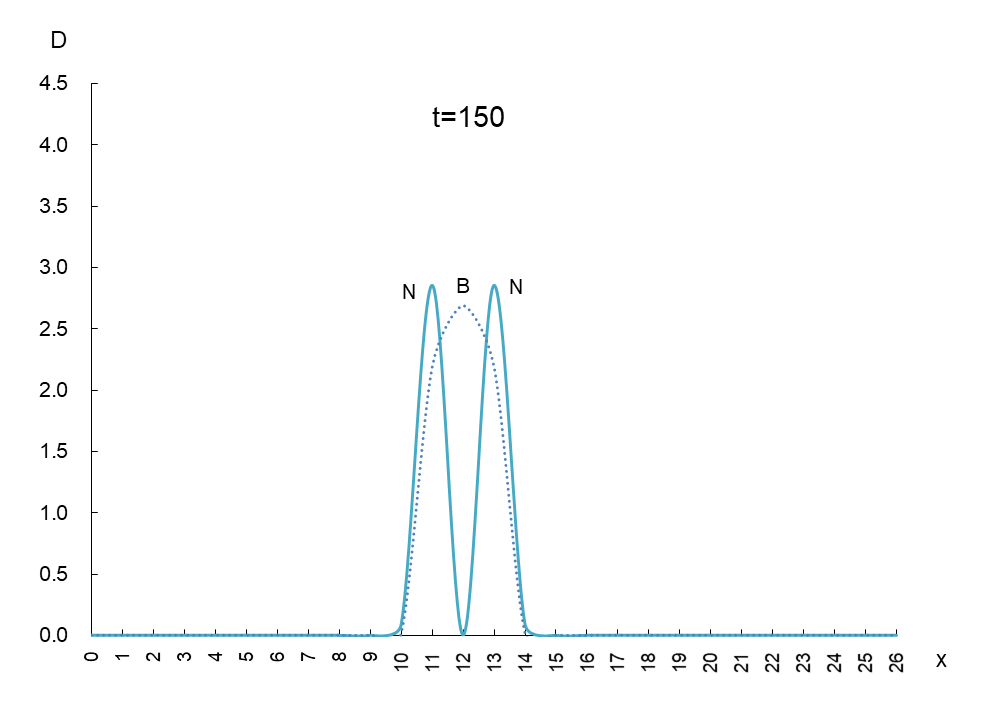
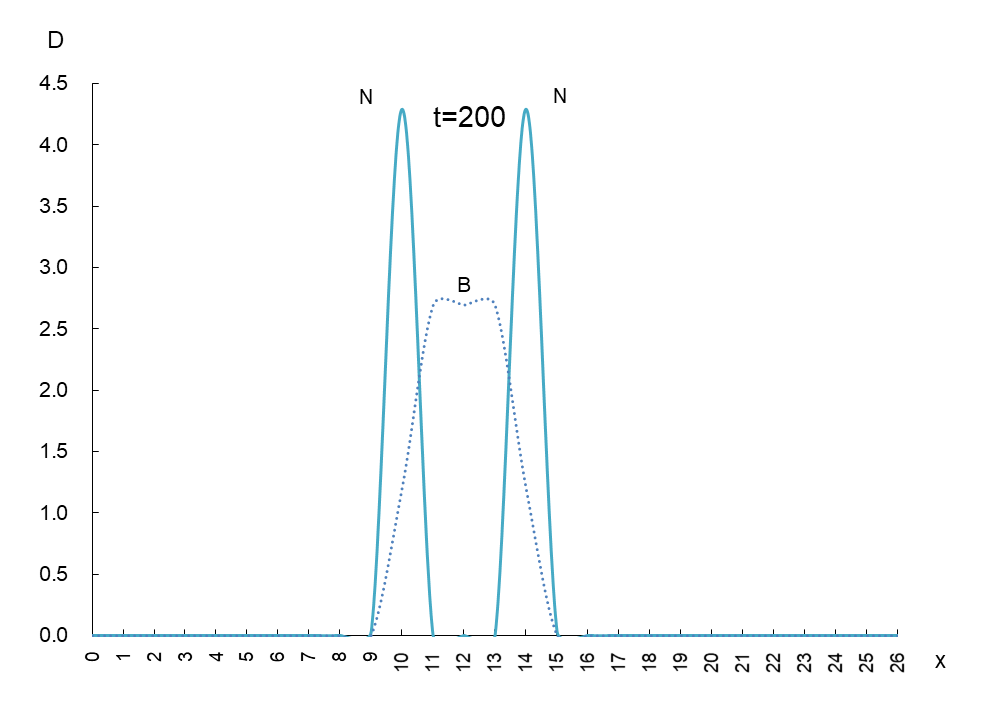
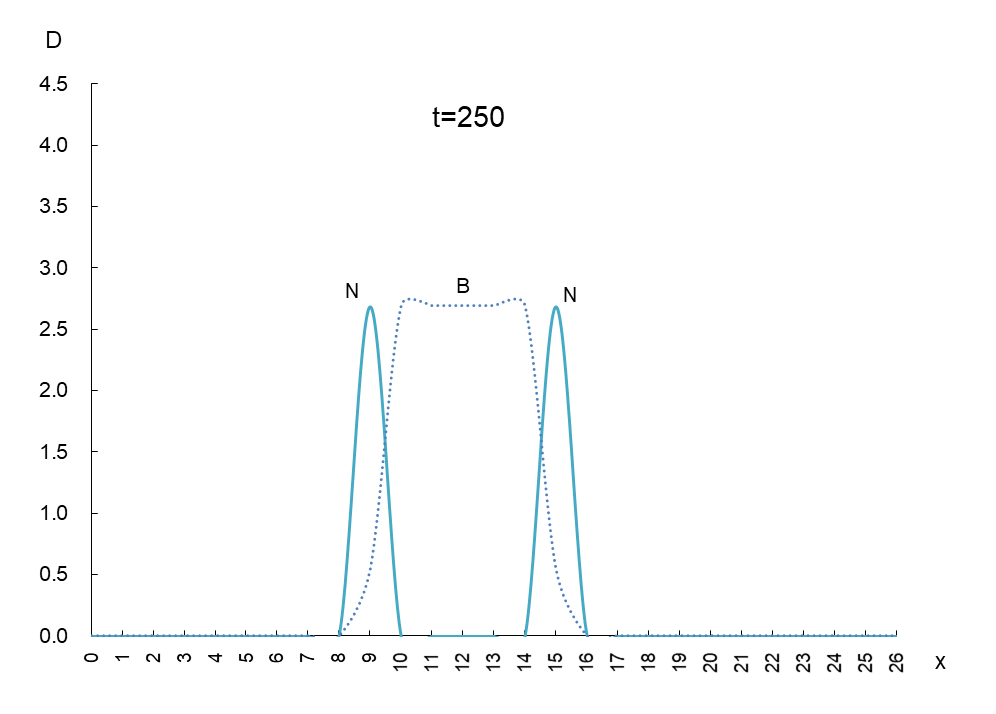
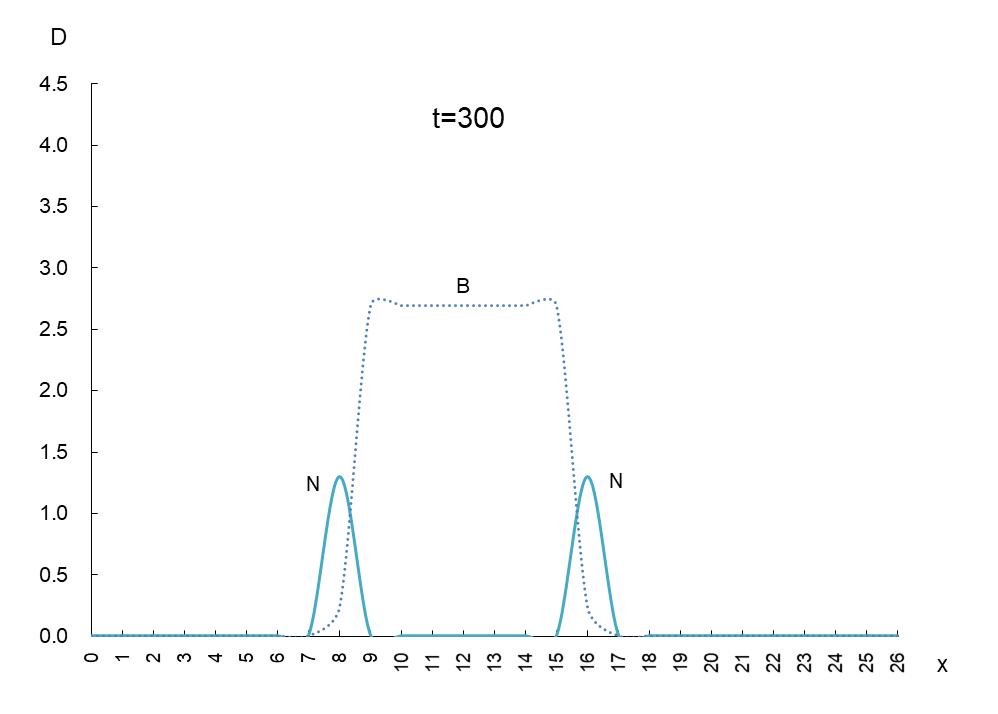
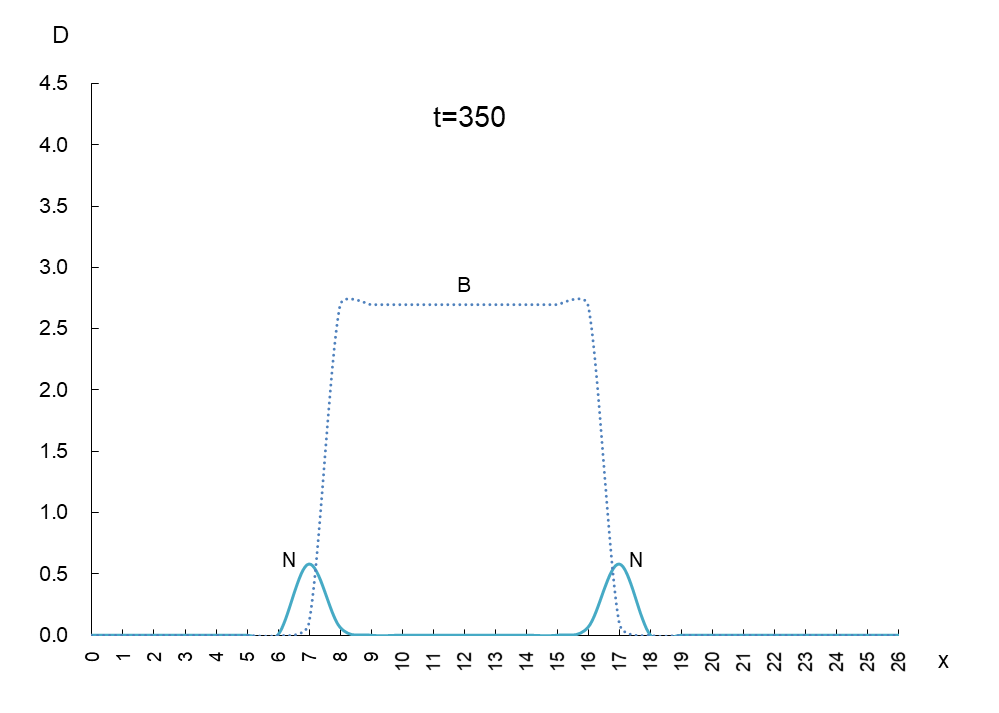
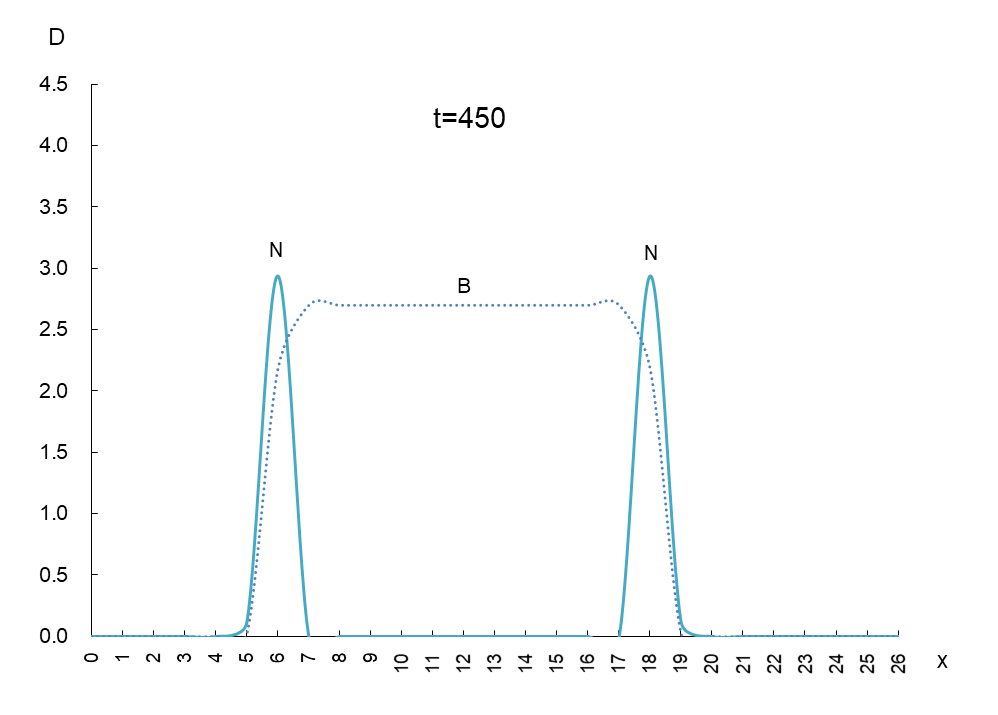
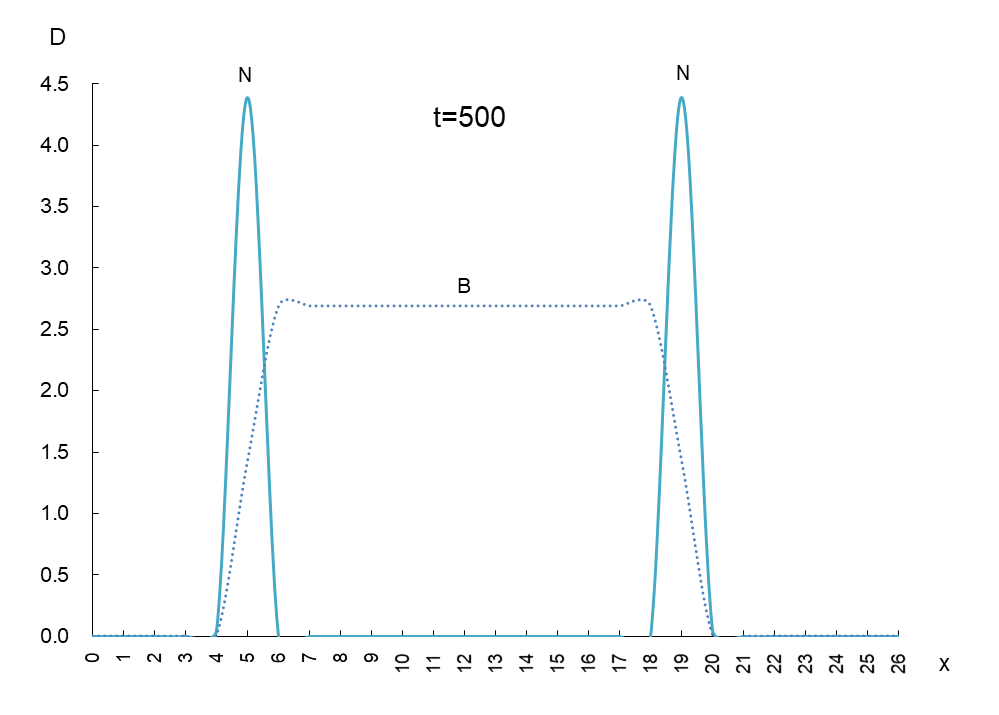
In order to observe the behavior of antigen N (solid line) and antibody B (dashed line), we took a few more pictures. What can be read from these images is as follows
1) Antigen N is indeed escaping from antibody B.
2) Antigen N repeatedly increases and decreases (0.5-4.5) while escaping, but the density of antibody B (2.7) remains constant.
3) The migration speed of antigen N and antibody B is constant.
These are quite interesting results.
Now, let’s set the horizontal axis of Figure 1 to time t and the vertical axis to the density of antigen N. See Figure 2. The antigen density N ripples with time.
Figure 2
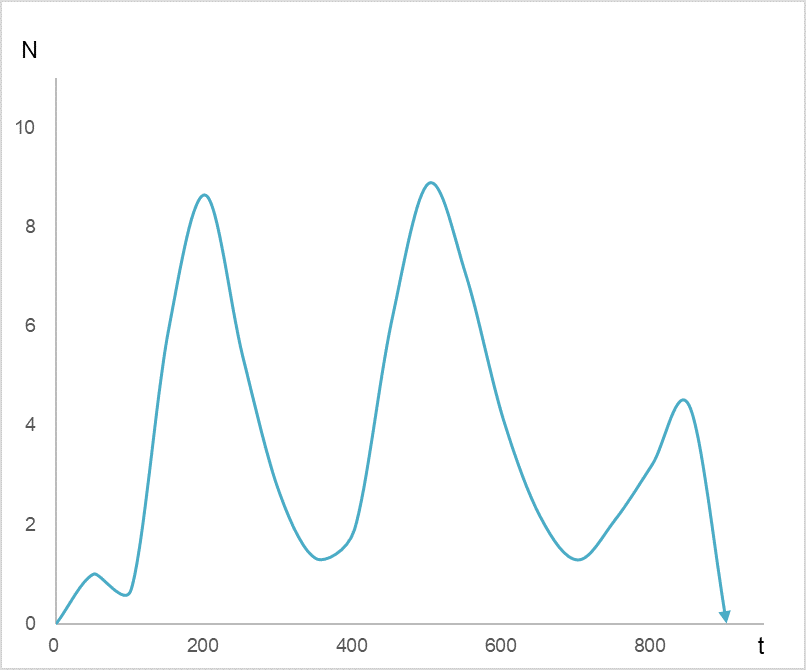
Waves of antigen density N
Figure 3 is a graph I posted on my blog on August 15, 2021. The dots show the number of infected people announced daily by the Ministry of Health, Labor and Welfare (MHLW), plotted by week.
Figure 3
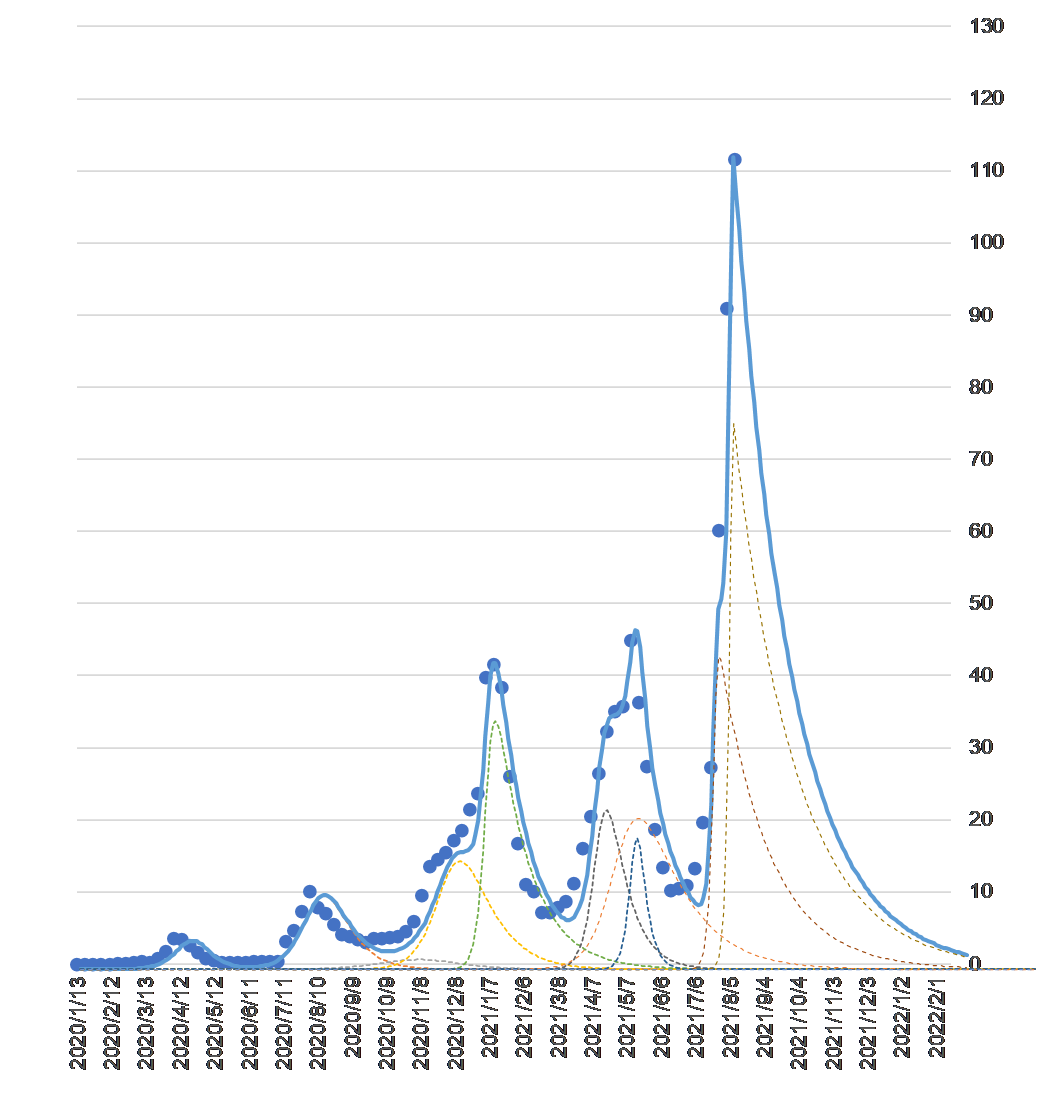
Number of COVID-19 infections (vertical axis unit: .000) by week and convergence forecast by synthetic wave
The waves of each mutation species are represented by dashed lines. The composite wave of the mutation waves is the solid blue line. The reason why the solid line is almost identical to the actual number of infected people is because the parameters of each mutant are adjusted to make it so (see the blog dated November 22, 2020 for the specific method).
The mathematical model used in this study was an equation built from the perspective of a predator (virus) eating its prey (humans) (Lotka-Volterra predator system version, blog dated April 16, 2020), but the antigen escape model used in this study is built from the perspective of a virus that must continue to escape from antibodies. Although the approach to each model is different, both models can mathematically reproduce the phenomenon of a surge in the actual number of infected people.
The end
Back to archive